CONGENITAL HEART DISEASE (Cardiac Shunts & Patent Ductus Arteriosum) & CARDIAC VALVE EVALUATION
Notes
· Gadolinium may not be needed for congenital heart disease evaluation.
· If possible, the supervising radiologist should review the initial images to localize the cardiac shunt and/or cardiac valves to determine the proper imaging planes for the rest of the exam. The following table lists suggested image planes...
· Gradient echo cine or hybrid gradient echo/echo planar imaging may be added for improved detection of turbulent flow in particular planes.
Pulse Sequences
1. 3 Plane Survey
Axial Plane
2. B-TFE
3.
INTERACTIVE
Cardiac imaging plane should be selected by supervising radiologists based on the location of the mass
4. B-TFE_BH *confirm the location and optimal imaging plane for the shunt and/or valve
5. T2W-BB
6. T1_TSE-BB
7.
DYNAMIC FIRST-PASS PERFUSION *Optional
*(obtain in the plane of the shunt)
8.
IR_TFE_LOOKLOCKER *Optional
9. B-TFE_BH (4 Chamber)
10. B-TFE_BH (Short Axis) *This series is used for ejection fraction calculation and should be relatively motion free.
11. B-TFE_BH (2 Chamber)
12. IR_TFE_3D_BH *Optional
13. IR_TFE_3D_BH (4 Chamber) *Optional
14. Spoiled GRE
PHASE CONTRAST
15. SQFLOW_BH Obtain phase contrast images of the Ascending Aorta and Main Pulmonary Artery to calculate the Qp/Qs as illustrated below...
Valve Planimetry *Optional
16. Obtain images at the level of the stenotic valve as illustrated below...
References & Illustrations
Ø
Standardized cardiovascular magnetic resonance
imaging (CMR) protocols, society for cardiovascular magnetic resonance: board
of trustees task force on standardized protocols http://scmr.org/assets/files/1532-429X-10-35.pdf
Ø Cardiovascular Flow Measurement with Phase-Contrast MR Imaging: Basic Facts and Implementation http://radiographics.rsna.org/content/22/3/651.full
o Ascending Aorta- (a) Localizing (left), magnitude (middle), and velocity (right) images show a normal ascending aorta (Ao). The imaging plane is prescribed in an oblique sagittal localizing image (red line). LA = left atrium, PA = pulmonary artery. (b) Graph shows estimates of flow in the ascending aorta.
(a)
(b)
o Main Pulmonary Artery- (a) Localizing (left), magnitude (middle), and velocity (right) images show a normal pulmonary artery (PA). Red line in the localizing image indicates the imaging plane of the flow images. Ao = aorta, LA = left atrium, LV = left ventricle. (b) Graph shows estimates of flow in the pulmonary artery.
(a)
(b)
o Use the following guidelines for setting the initial VENC for phase contrast series…
Ascending Aorta
o
The encoding velocity for the first measurement
or for flow measurement is 200 cm/sec.
The usual velocity for peak velocity measurement is 100–160 cm/sec.
Main Pulmonary Artery
o
The encoding velocity for the first measurement
or for flow measurement is 180 cm/sec.
The usual velocity for peak velocity measurement is 60–120 cm/sec.
Right and Left Pulmonary Arteries
o
The encoding velocity for the first measurement
or for flow measurement is 200 cm/sec.
The usual velocity for peak velocity measurement is 60–120 cm/sec.
SVC and Inferior Vena Cava
o
The encoding velocity for the first measurement
or for flow measurement is 110 cm/sec.
The usual velocity for peak velocity measurement is 50–80 cm/sec.
Ø Planimetry of Mitral Valve Stenosis by Magnetic Resonance Imaging http://content.onlinejacc.org/cgi/content/full/45/12/2048
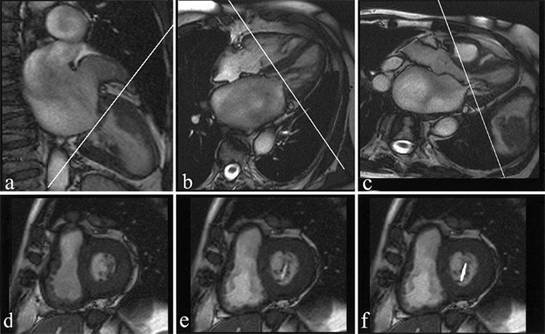
o Magnetic resonance images to define the imaging plane. Diastolic two-chamber (a), four-chamber (b), and three-chamber (c) views. A jet originating from the mitral valve leaflets is visible. The subsequent slices were defined perpendicular to the valvular plane and, in cases of orifices with an eccentric outlet, perpendicular to the origin of the jet in the left ventricle. Visualization of the diastolic opening of the mitral valve orifice. (d) Systolic image parallel to the closed mitral valve. (e) Diastolic image of the same plane showing the small orifice in this patient. (f) Planimetry as drawn in with a resulting orifice area of 0.6 cm2, representing severe mitral stenosis (corresponding cardiac catheterization-mitral valve area resulted also in 0.6 cm2 and echocardiography-mitral valve area resulted in 0.7 cm2).
Phase Contrast Articles
Ø Cardiovascular Applications of Phase-Contrast MRI http://www.ajronline.org/cgi/content/full/192/3/662
Ø Cardiovascular Flow Measurement with Phase-Contrast MR Imaging: Basic Facts and Implementation http://radiographics.rsna.org/content/22/3/651.full
SVC and Inferior Vena Cava:
The encoding velocity for the first measurement or for
flow measurement is 110
cm/sec. The usual velocity for peak velocity measurement is 50–80 cm/sec.
Ascending Aorta:
The encoding velocity for the first measurement or
for flow measurement is 200 cm/sec. The usual velocity for peak velocity measurement is 100–160 cm/sec.
Main Pulmonary Artery:
The encoding velocity for the first measurement or
for flow measurement is 180 cm/sec. The usual velocity for peak velocity measurement is 60–120 cm/sec.
Right and Left Pulmonary Arteries:
The encoding velocity for the first measurement or
for flow measurement is 200 cm/sec. The usual velocity for peak velocity measurement is 60–120 cm/sec.
Ø Quantification of Flow Dynamics in
Congenital Heart Disease: Applications of Velocity-encoded Cine MR Imaging http://radiographics.rsna.org/content/22/4/895.full
Rev: 5/13/10