COMPREHENSIVE CARDIAC (Includes
Cardiac Viability, Cardiomyopathy, Sarcoidosis, Pericarditis, &
Myocarditis)
Notes
Ø Make sure the entire left ventricle is including on all scans.
Ø Use SENSE to improve imaging time.
Pulse Sequences
1. 3 Plane Survey
2. B-TFE (Axial)
3.
INTERACTIVE
4. T1_TSE-BB (Short Axis)
5. T2W-BB (Short Axis)
6. T2W-BB (4 Chamber)
7.
DYNAMIC FIRST-PASS PERFUSION
8. B-TFE_BH (2 Chamber)
9. B-TFE_BH (3 Chamber) *Optional: Used if Asymmetric Septal Hypertrophy is the indication
10. B-TFE_BH (Short Axis) *This series is used for ejection fraction calculation and should be relatively motion free.
11. B-TFE_BH (4 Chamber)
12.
IR_TFE_LOOKLOCKER
13. IR_TFE_3D_BH (Short Axis)
14. IR_TFE_3D_BH (4 Chamber)
15. IR_TFE_3D_BH (2 Chamber)
16. SQFLOW_BH (transverse view at the level of the coronary ostia as indicated below…)
17. SQFLOW_BH *Optional. When the history is “Hypertrophic Obstructive Cardiomyopathy, obtain phase contrast images of aortic outflow tract and aortic root as illustrated below...
References & Illustrations
Ø
Standardized cardiovascular magnetic resonance
imaging (CMR) protocols, society for cardiovascular magnetic resonance: board
of trustees task force on standardized protocols http://scmr.org/assets/files/1532-429X-10-35.pdf
Ø Evaluation of Cardiac Valvular Disease with MR Imaging: Qualitative and Quantitative Techniques http://radiographics.rsnajnls.org/cgi/content/full/23/1/e9
o When
evaluating for aortic insufficiency,
slice positioning is fairly important: the phase contrast slice should be
positioned above the valve at the level of the coronary ostia. Sections
positioned in a more distal location (for instance at the level of the right
pulmonary artery) tend to underestimate the amount of regurgitant flow.
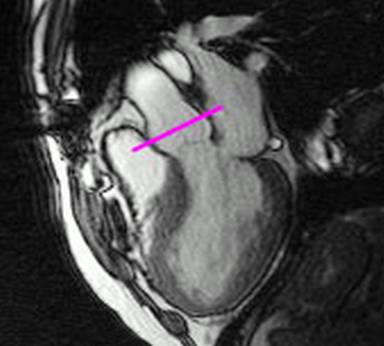
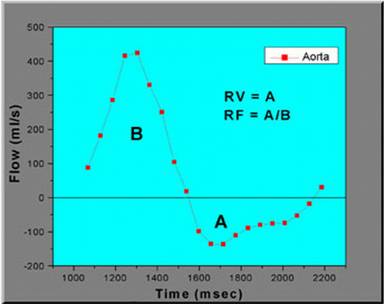
o Transverse View At The Level Of The Coronary Ostia: (Left Image) Prescription of a cine phase-contrast section at the level of the coronary ostia to measure regurgitant volume. (Right Image) Flow curve through the proximal aorta in patient with aortic insufficiency. Regurgitant volume (RV) is the area under the time-flow curve below zero (A). Regurgitant fraction (RF) represents the ratio of regurgitant flow to forward flow (A/B).
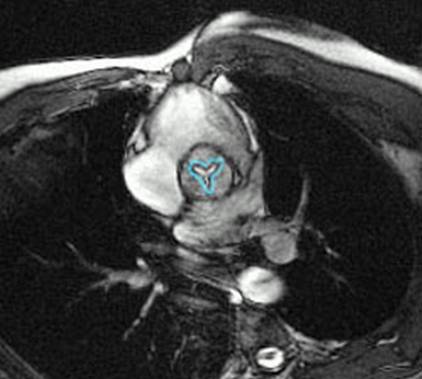
o Single frame from cine sequence through stenotic aortic valve used to measure valve area. This frame represents the maximal area of the open valve (blue outline). High-resolution images and multiple thin sections are important for accurate and reproducible results. Phase-contrast images can also be used to estimate valve area.
Ø Cardiovascular Applications of Phase-Contrast MRI http://www.ajronline.org/cgi/content/full/192/3/662
o Hypertrophic obstructive cardiomyopathy. Magnitude (A) and in-plane phase-contrast (TR, 55; acquisition time, 24.7 seconds; voxel size, 2.0 x 1.2 x 6 mm; velocity-encoding value, 250 cm/s; retrospective gating) (B) images with corresponding mean velocity-time graph (C) show substantial flow turbulence that starts at level of left ventricular outflow tract (arrow) related to systolic anterior motion of mitral valve leaflets. Through-plane phase-contrast imaging at level of left ventricular outflow tract (LVOT) (TR, 55; acquisition time, 25.5 seconds; voxel size, 2.0 x 1.2 x 6 mm; velocity-encoding value, 250 cm/s, retrospectively gated) (solid line, C) and at level of aortic root (TR, 55; acquisition time, 25.6 seconds; voxel size, 2.0 x 1.2 x 6 mm; velocity-encoding value, 250 cm/s; retrospective gating) (dashed line, C) shows significant flow acceleration at level of LVOT but not at level of aortic valve (AV). Late peaking of LVOT velocity is related to dynamic systolic anterior motion of mitral valve leaflets that increases throughout systole, becoming greatest near end-systole compared with mid peaking aortic valve velocity, which occurs with fixed lesions.
A)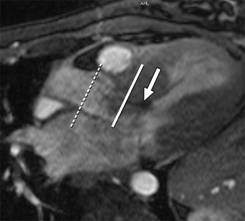 B)
B)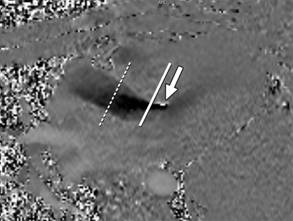 C)
C)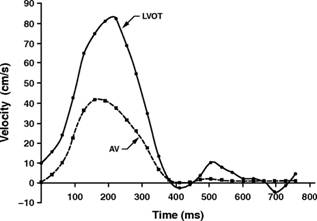
Phase Contrast Articles
Ø Cardiovascular Applications of Phase-Contrast MRI http://www.ajronline.org/cgi/content/full/192/3/662
Ø Cardiovascular Flow Measurement with Phase-Contrast MR Imaging: Basic Facts and Implementation http://radiographics.rsna.org/content/22/3/651.full
SVC and Inferior Vena Cava:
The encoding velocity for the first measurement or for
flow measurement is 110
cm/sec. The usual velocity for peak velocity measurement is 50–80 cm/sec.
Ascending Aorta:
The encoding velocity for the first measurement or
for flow measurement is 200 cm/sec. The usual velocity for peak velocity measurement is 100–160 cm/sec.
Main Pulmonary Artery:
The encoding velocity for the first measurement or
for flow measurement is 180 cm/sec. The usual velocity for peak velocity measurement is 60–120 cm/sec.
Right and Left Pulmonary Arteries:
The encoding velocity for the first measurement or
for flow measurement is 200 cm/sec. The usual velocity for peak velocity measurement is 60–120 cm/sec.
Ø Quantification of Flow Dynamics in
Congenital Heart Disease: Applications of Velocity-encoded Cine MR Imaging http://radiographics.rsna.org/content/22/4/895.full
Rev: 5/13/10